Debugging with Codezero

One of the hardest things to do is to figure out what the problem is with a production service. Exception management tools like Sentry can help you identify where the error occurs, and centralized logging can display your logs. Still, sometimes you want to set a breakpoint and see exactly what's happening.
Recently, I was faced with a bug in production that I couldn't reproduce using the data in my local system. While the system has an externally accessible API, the web application also includes some internal microservices that are not exposed via the API. These internal microservices run several machine learning models and are memory-intensive, requiring access to GPUs to perform optimally.
Since the web application and internal microservices run in a Kubernetes cluster, I can use Codezero Zero Environment Development to consume the microservices running in the cluster from my local development environment with just a DNS entry.
Unlike other options, such as port forwarding, Codezero will continue to work even when the remote service is redeployed and restarted.
Setup Codezero
To get started, I installed the Codezero client using brew
brew install c6o/tap/codezero-appI then went to hub.codezero.io, logged in with my Google account and created a new organization.
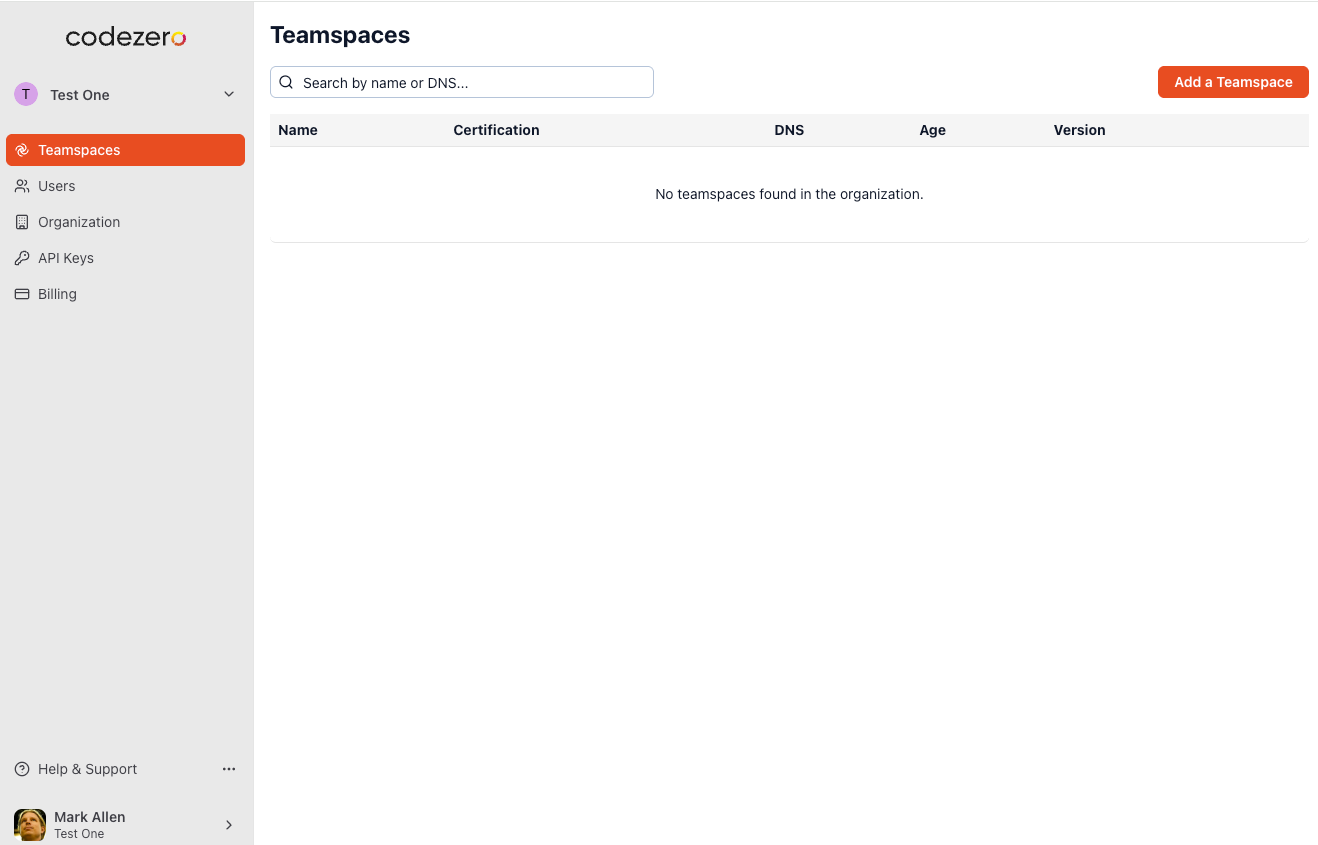
In that organization, I created a new teamspace. A teamspace is a logical connection to a kubernetes cluster that you can share with other people on your development team.
I then installed codezero into my kubernetes cluster.
helm repo add --force-update codezero https://charts.codezero.io && \
helm install --create-namespace --namespace=codezero \
--set space.name='testone' --set org.id='my org id' \
--set org.apikey='this is a secret' \
--set hub.url='https://hub.codezero.io' codezero codezero/codezero
Then I could open the desktop app and see my services.
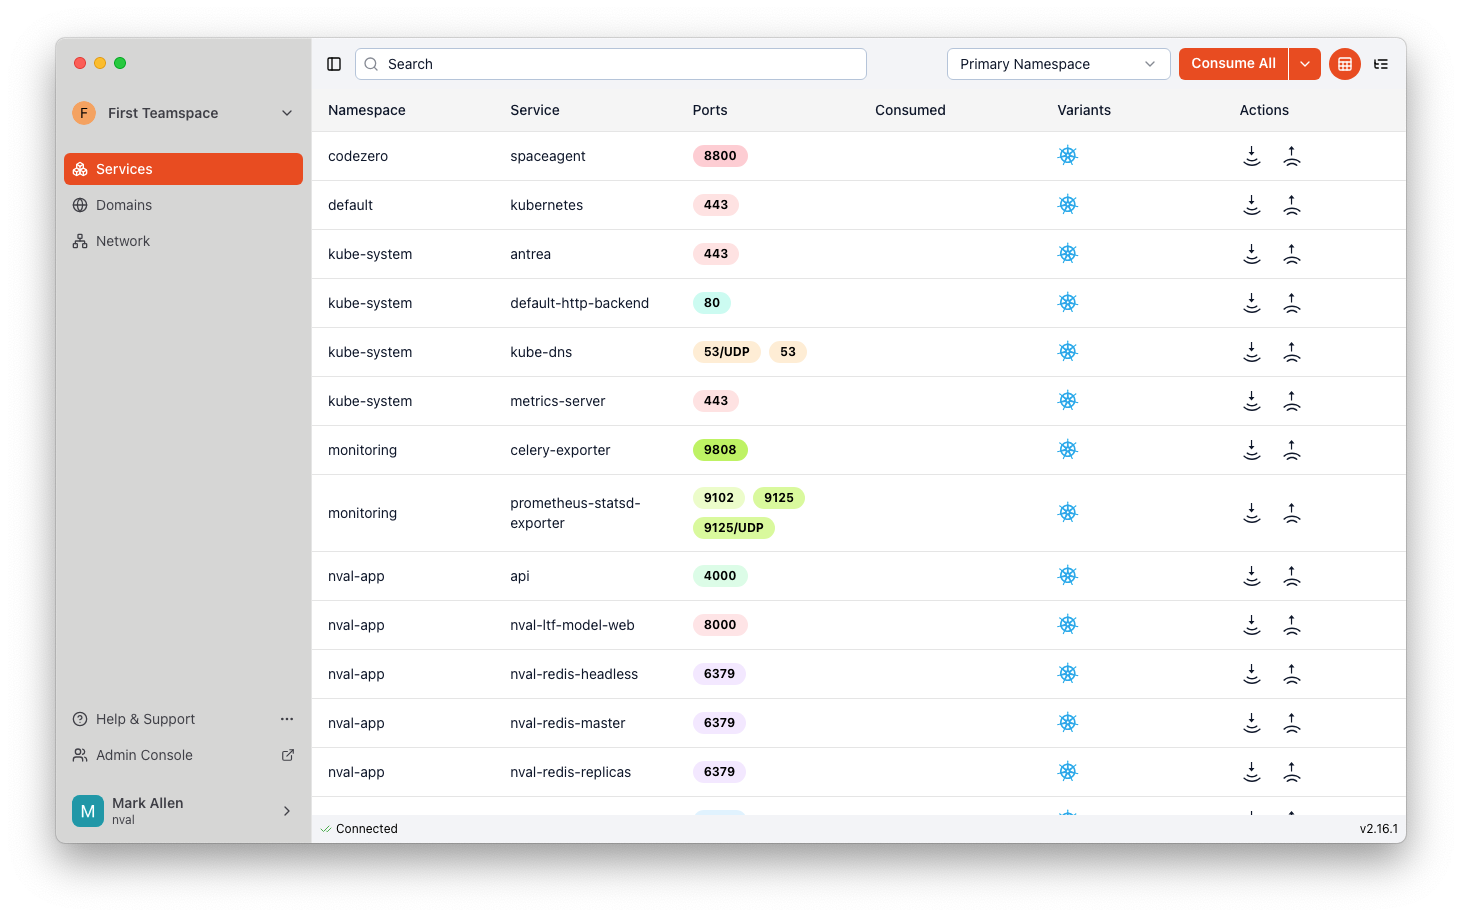
Now I can consume the web microservice running on port 8000. To do this, I click on the consume icon, the one with the arrow pointing down, next to the web service.
I can check that it is running from the command line:
czctl consume viewWhich returns:
nval-ltf-model-web.nval-appDebugging with Codezero
Now that I have Codezero running, I can access the internal microservices from my local machine using just a DNS entry.
curl http://nval-ltf-model-web.nval-app:8000/And it returns what I expect.
{
"collections": "http://nval-ltf-model-web.nval-app:8000/collections/",
"greenlists": "http://nval-ltf-model-web.nval-app:8000/greenlists/"
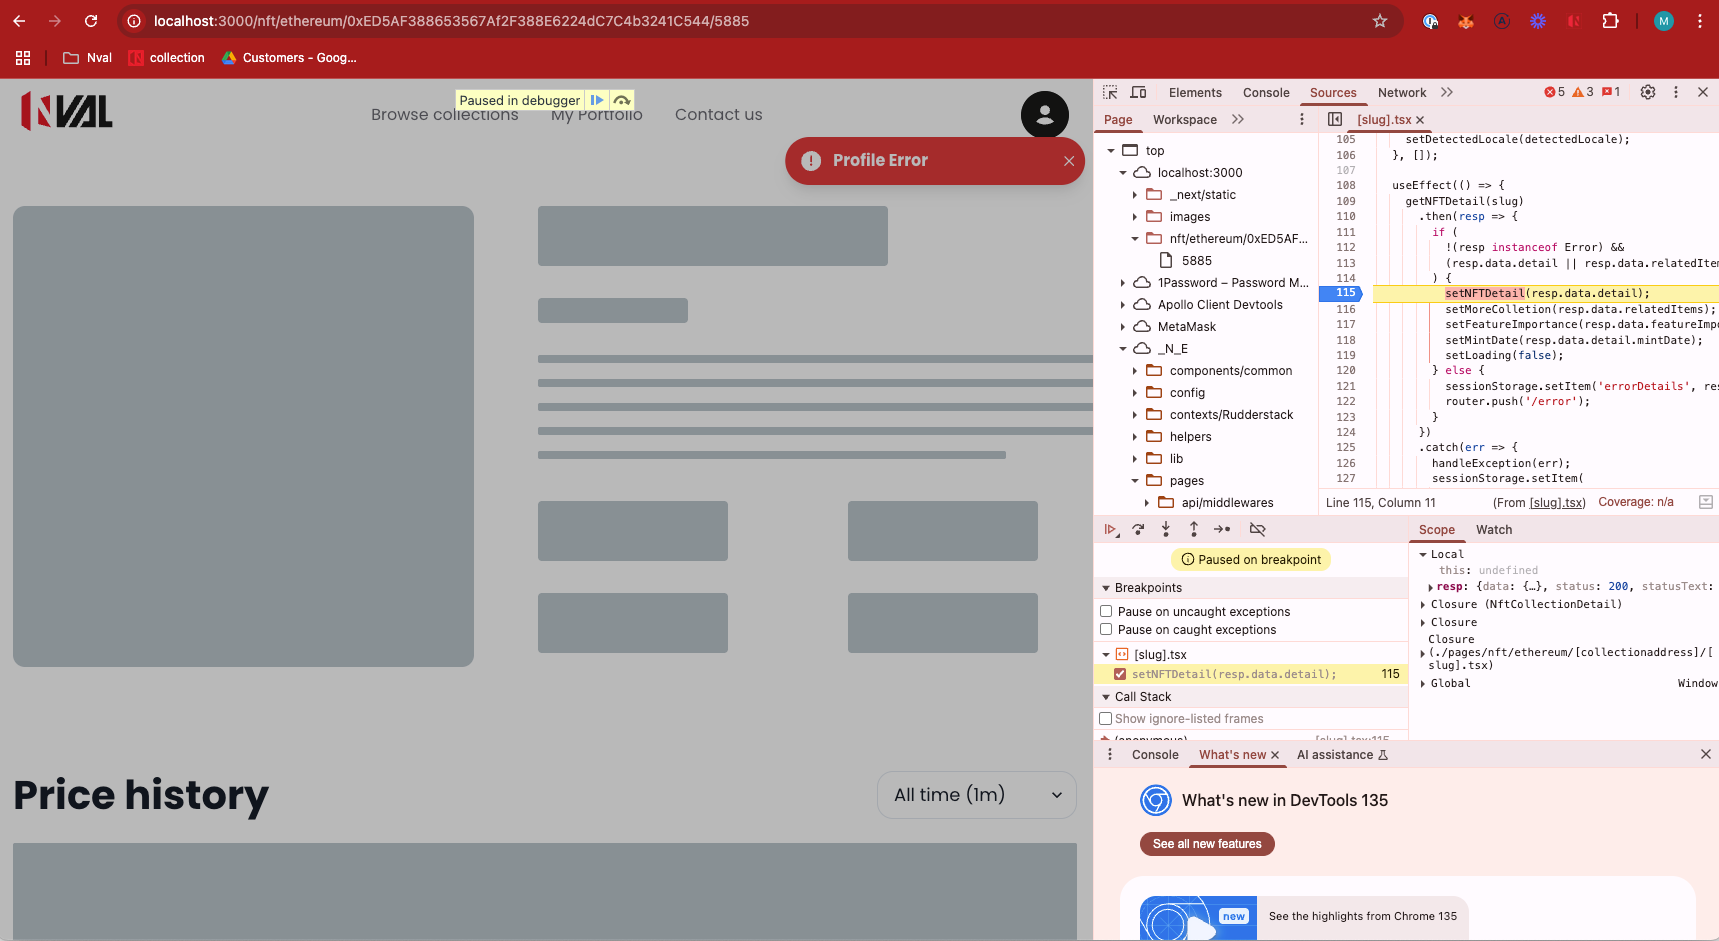
}From here, I can now replace my locally hosted internal microservice with this URL and access the backend without exposing it to the internet.
I now have access to all the data I need to debug the application using the tools on my local workstation.
Conclusion
By leveraging Codezero's Zero Environment Development, I was able to seamlessly debug the production issue without needing to replicate the entire environment locally. This approach allowed me to interact with the internal microservices in real-time, as if they were running natively on my machine, eliminating the need for complex networking hacks or environment replication. In a landscape where diagnosing production issues often feels like chasing shadows, having a reliable, persistent connection to your live services makes a world of difference.
Want to try it out yourself? There’s a simple tutorial app here - https://docs.codezero.io/tutorial - you can try it out on their live demo cluster (no k8s helm install required).